Enhanced financial summary: Get the full financial picture in one place
Get comprehensive visibility into all financial components that drive serviceability calculations, eliminating the guesswork from application assessment.
October 02, 2024
Release
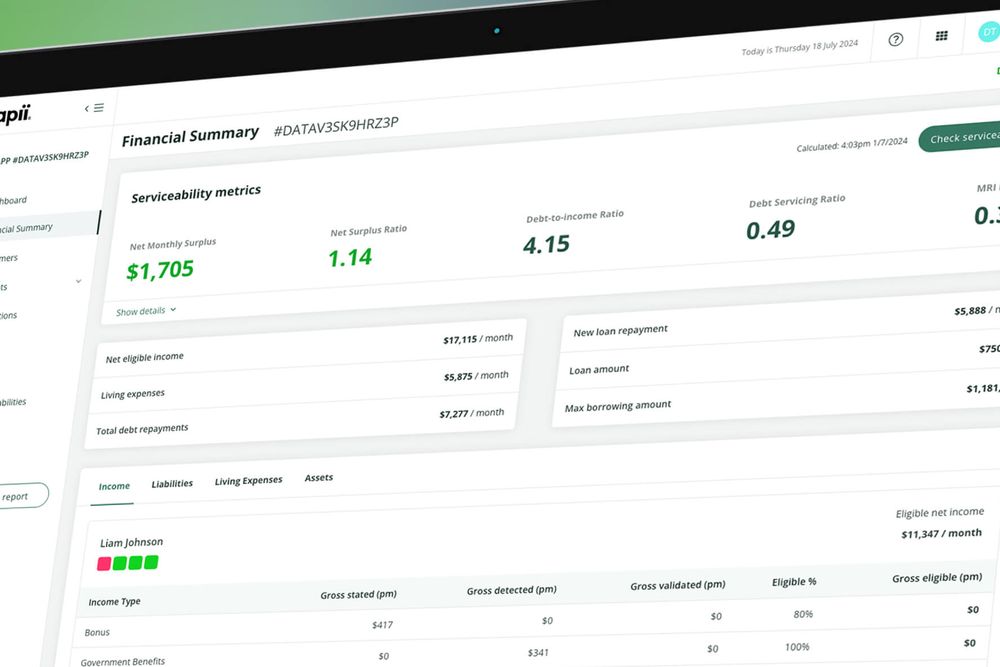
Get comprehensive visibility into all financial components that drive serviceability calculations, eliminating the guesswork from application assessment.
Previously, when reviewing an application with an unexpectedly low Net Servicing Ratio, you would need to navigate through multiple screens to understand the underlying factors. The financial summary changes this by consolidating all relevant financial data into a single, detailed view that shows not only what the numbers are, but how they’re calculated.
What is Xapii's financial summary?
The financial summary is an in-depth review that displays all financial data used in serviceability calculations. Providing detailed insights into income shading, liability repayments, and monthly expenses, giving you complete transparency into how we determine each servicing position.
How does it work?
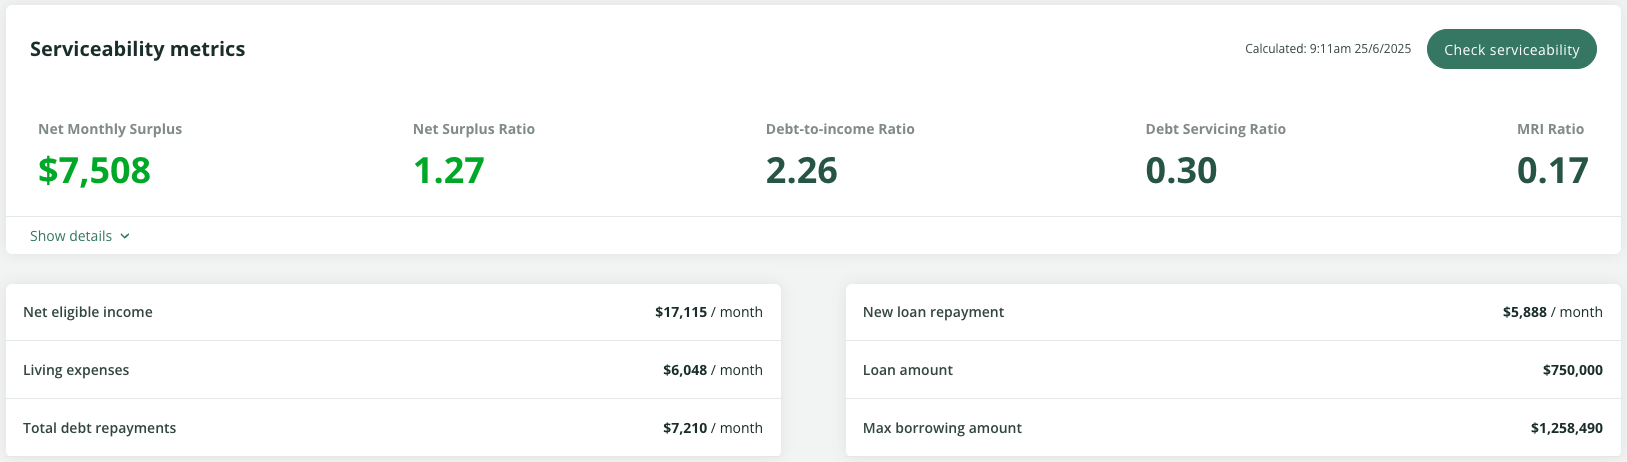
Below the serviceability result on the financial summary tab of Xapii, you'll find the core financial metrics that determine serviceability:
- Net eligible income: The sum of applicant’s net income
- Living expenses: The household's monthly living expenses
- Total debt repayments: The applicant's debt repayments including the new loan
- New loan repayment: The expected repayment for the loan the applicant is trying to borrow
- Loan amount: The amount the applicant wishes to borrow
- Max borrowing amount: The maximum the applicant can borrow
These high-level figures reflect the most accurate data available at the time of assessment. For example, in a joint application where you've validated one income source but not the other, the net eligible income per month will only include the validated income, ensuring calculation accuracy.
Breaking down the financial position
Income
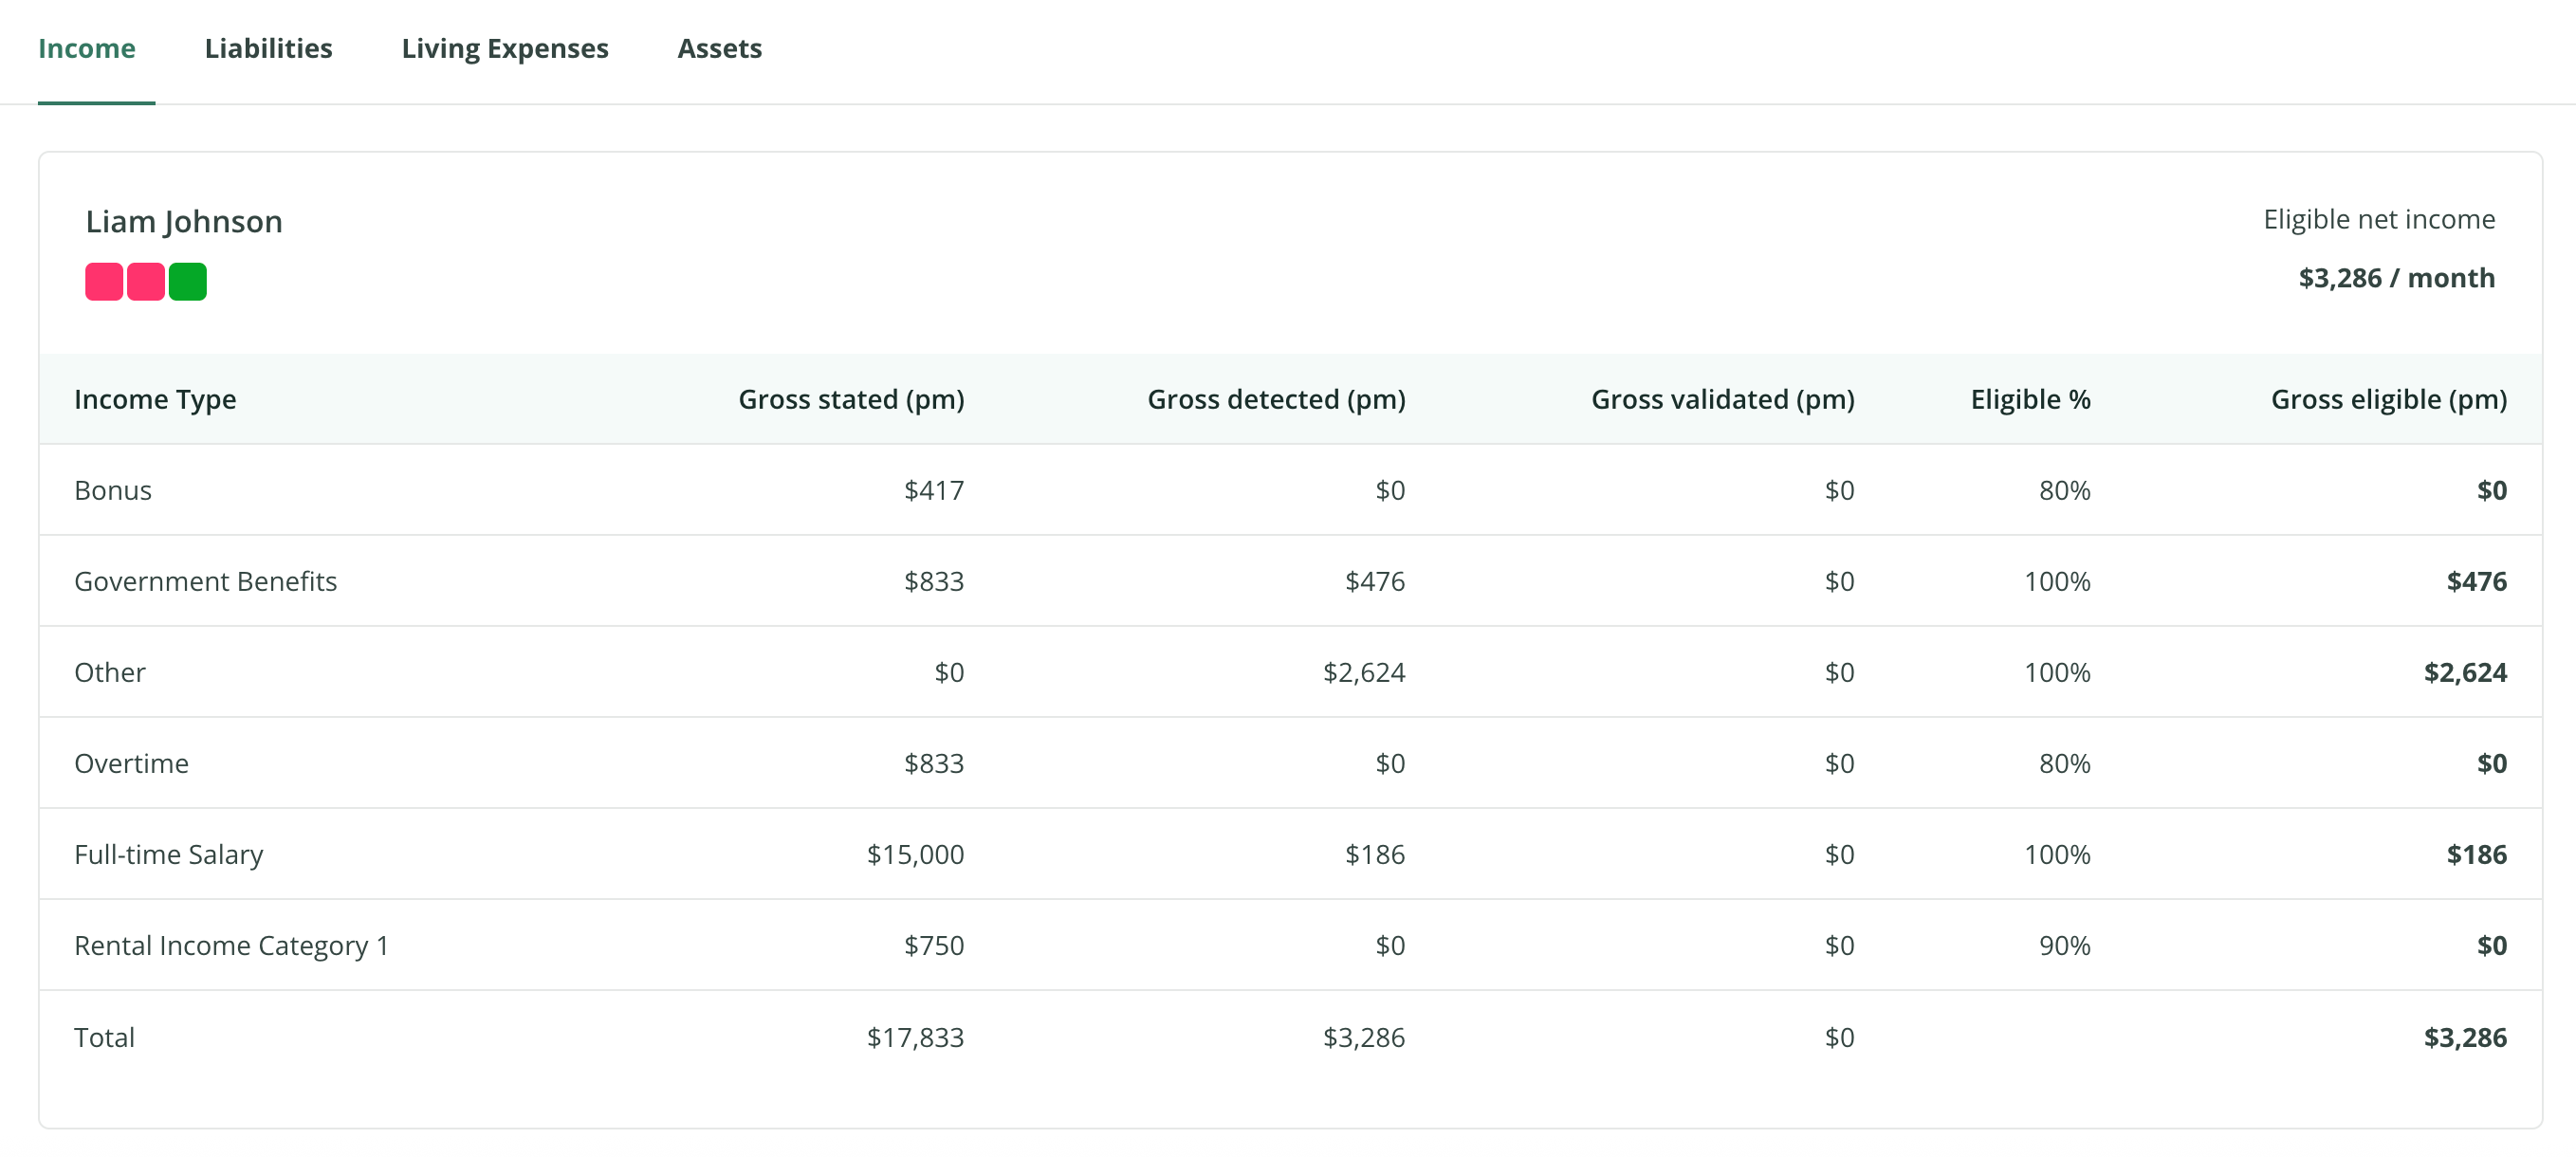
The income section shows eligible income for each applicant with an in-depth breakdown of gross incomes by type. Each income category shows the total monthly income across four key measurements:
- Gross stated
- Gross validated
- Eligibility percentage (income shading)
- Gross eligible income.
Attributable Income: The eligibility column shows the percentage of attributable income toward serviceability. For instance, salary income is usually taken at 100% of its value whereas bonuses are reduced to 80%. We only display income types on this screen that have some level of attribution to serviceability.So if a credit policy doesn’t accept certain income sources, it won’t show in the financial summary.
Liability position
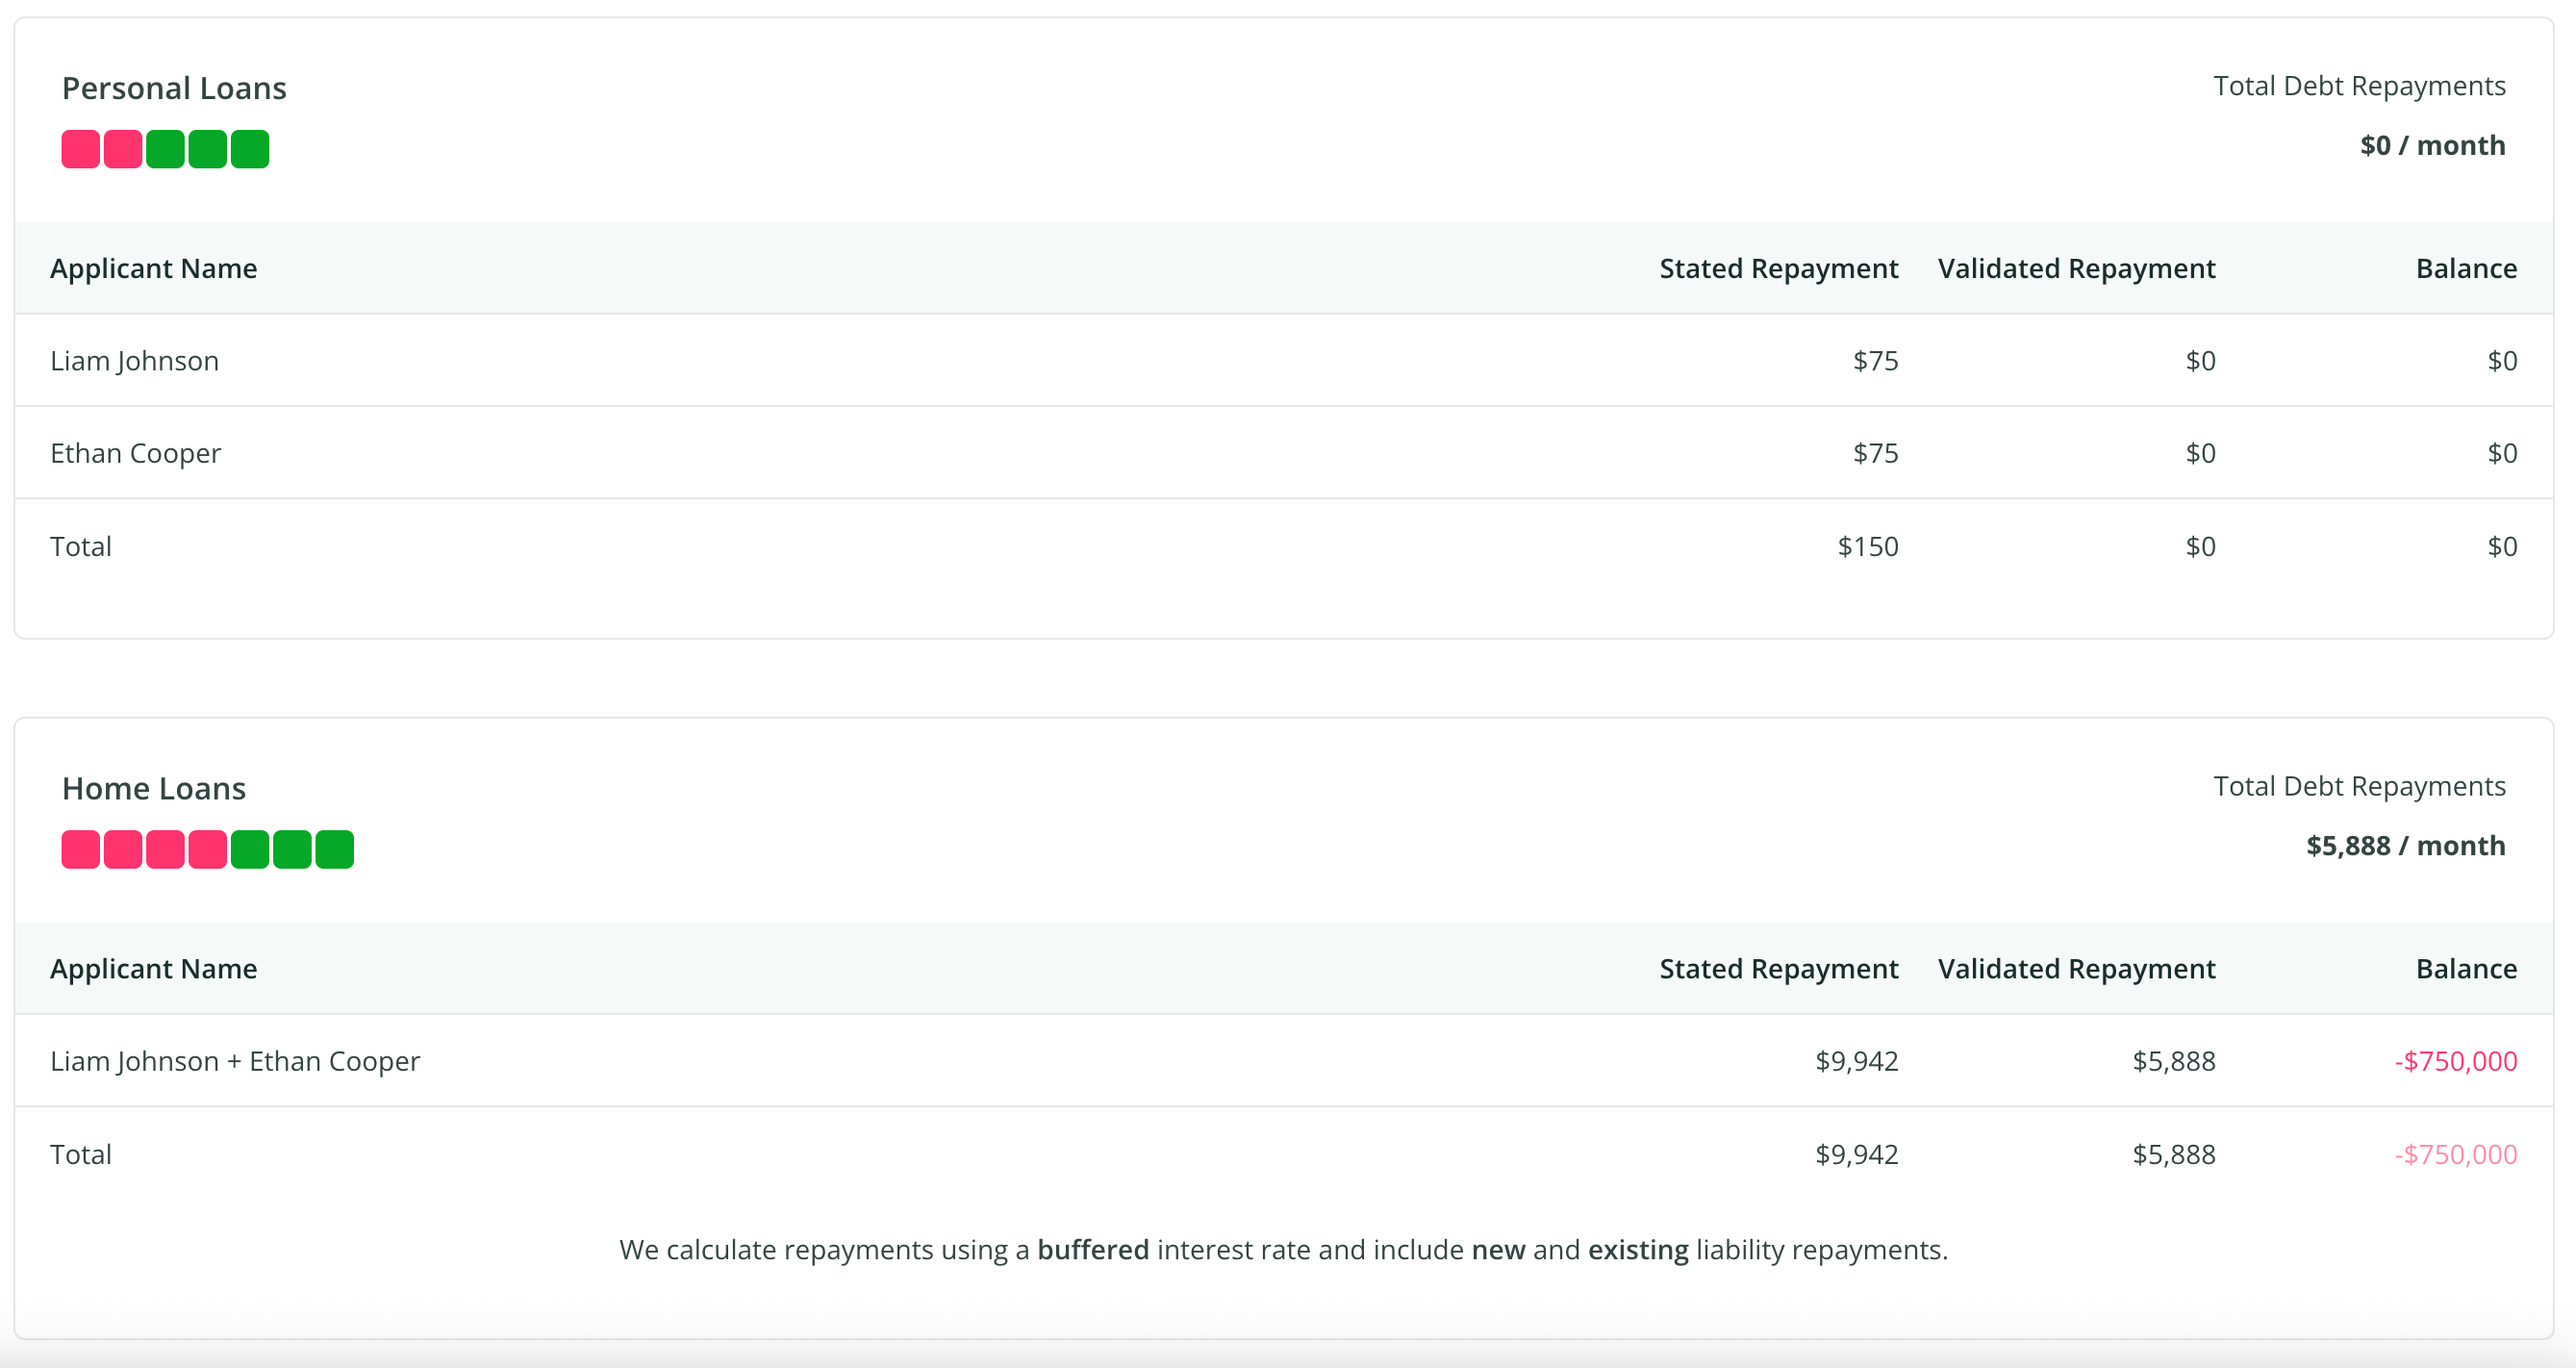
Credit cards: Xapii displays the application's total credit card limit and debt repayments. The table summarises the applicant's entire credit card position, including total stated repayments, validated repayments, total stated limit, and total validated limit.
Home loans and personal loans: Xapii displays the application's total debt repayments related to home loans, credit cards and personal loans. The table summarises the applicant's entire position, including total stated repayments, validated repayments, and balances. We calculate repayments using a buffered interest rate and include new and existing liability repayments.
HECS debt: Xapii shows the application's total debt repayments related to HECS debt.If applicants don't have HECS debt, this table won't appear. The difference between stated and validated HECS debt repayments reflects the taxable income used to determine the repayment percentage.
Expense position
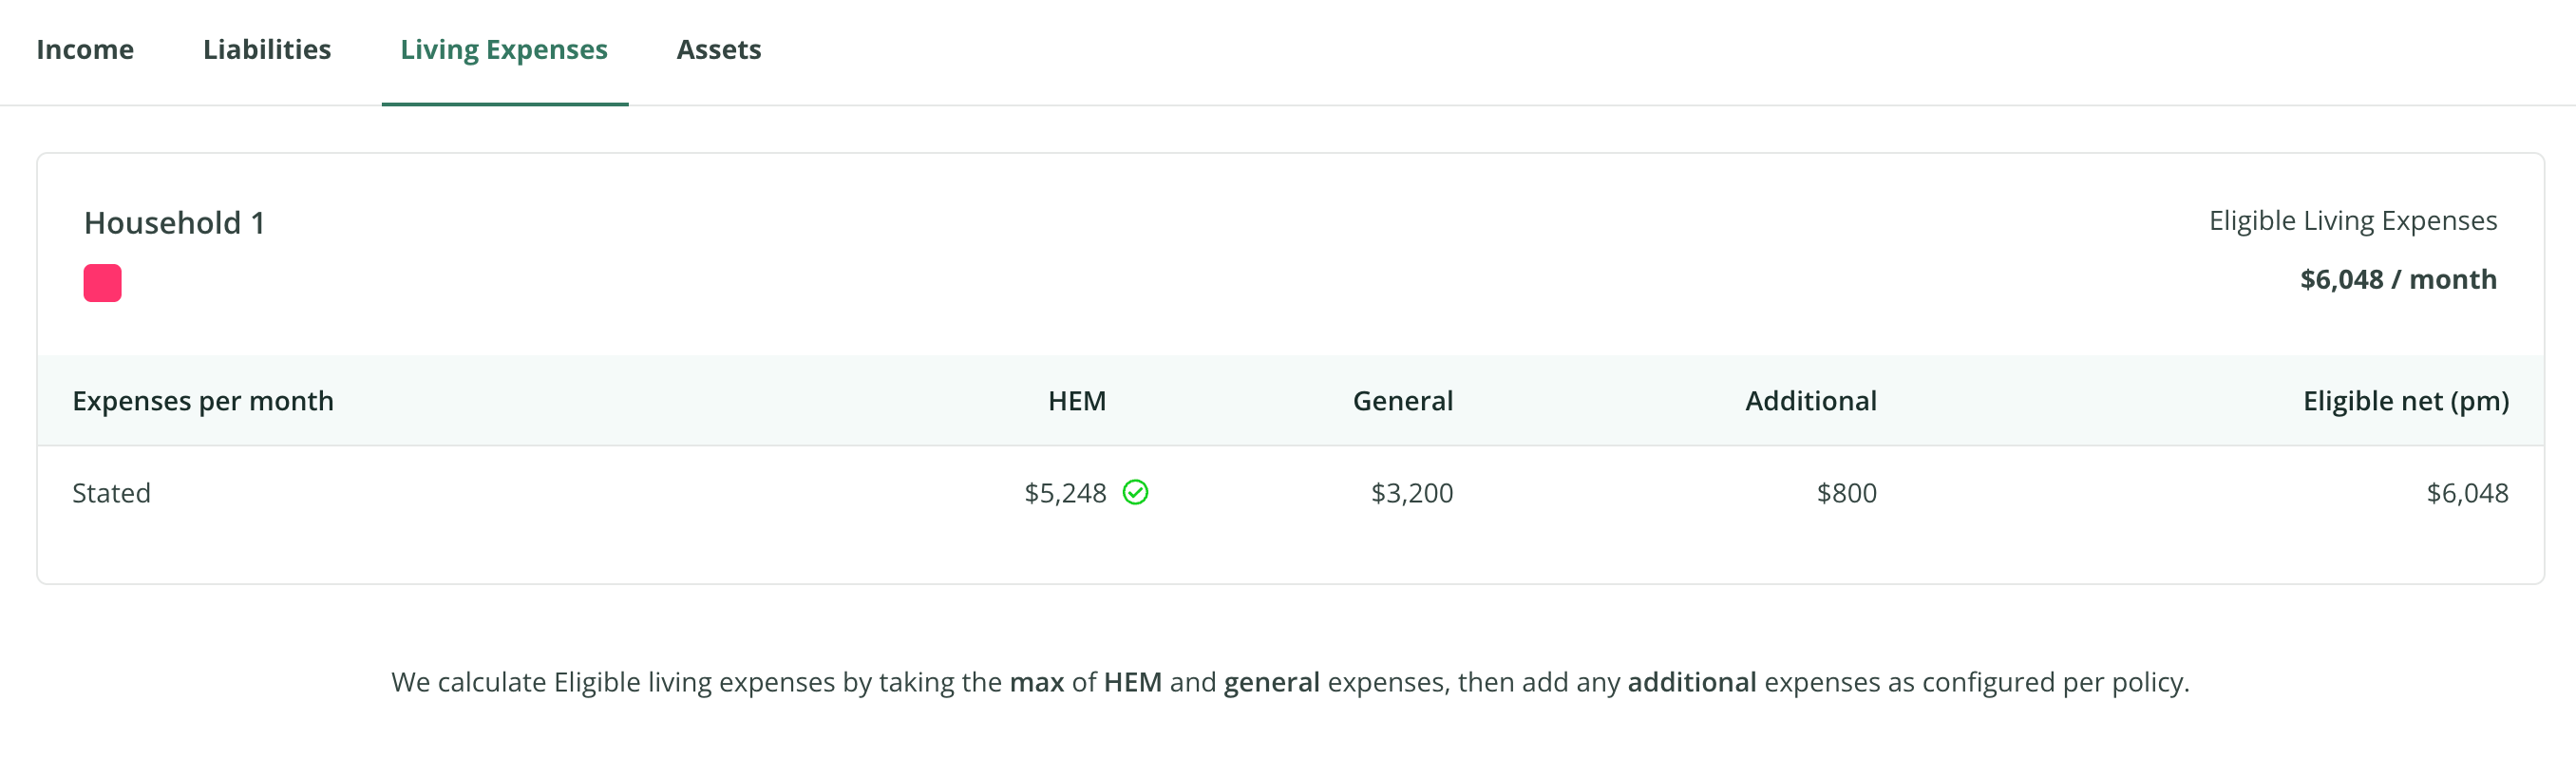
Xapii now shows monthly declared total eligible living expenses per household and any configured expense rules. We also explain how we calculated this figure, including whether we used HEM (Household Expenditure Measure).
The expense breakdown includes:
- HEM benchmark: A benchmark based on declared income, marital status, and number of dependents
- General expenses: Xapii compares these expense categories against the HEM benchmark
- Additional expenses: Xapii adds these expense categories to the result of the comparison between general expenses and the HEM benchmark
Asset position
Xapii will now show the applicant’s declared cash deposit compared to the money we detected in their savings account.
What this means for your workflow
Xapii’s financial summary features are a significant step forward in application transparency and efficiency.
By consolidating all serviceability-related financial data into a single view, you can now understand the complete financial picture without having to navigate across the platform.
This enhancement is particularly valuable when explaining serviceability decisions to customers or internal stakeholders, as every calculation is visible and traceable to its source. The financial summary maintains the same rigorous calculation standards while dramatically improving the user experience and decision-making process.
Related articles
Release
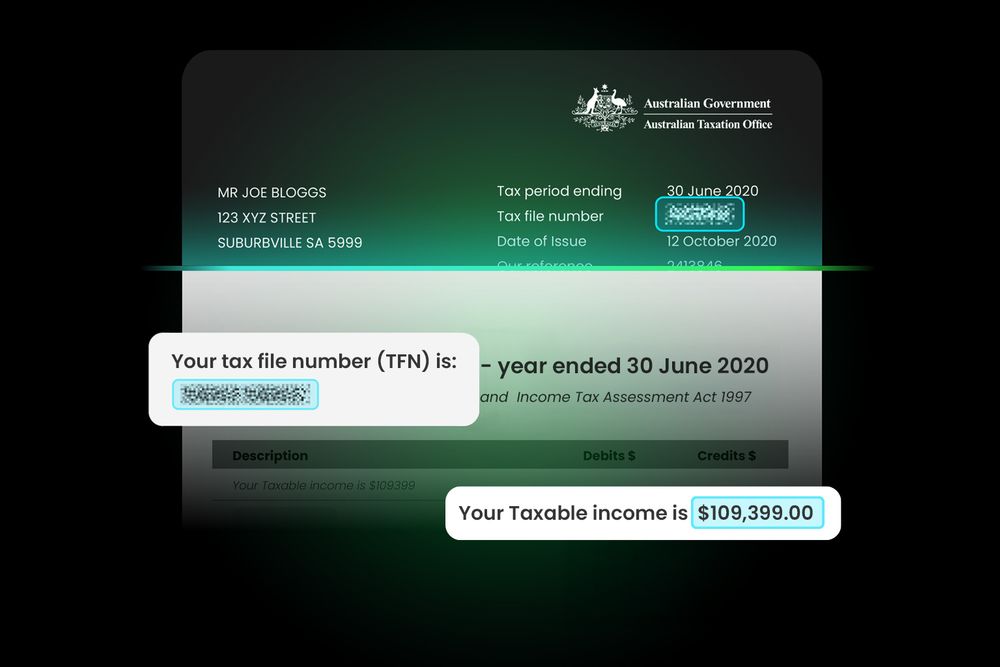
Effortless protection for your customer data with auto TFN redaction
TiimelyJul 7, 2025

Insights
Digital Transformation: The technology adoption and implementation dilemma
Tania DeMasiFeb 19, 2025

Insights
The Community-Owned banking landscape: Leveraging technology to enhance member experience.
Tania De MasiAug 1, 2025